How to add alt text?
- Right-click a picture and find View Alt Text.
- Write and edit the alt text.
- Make your alt text descriptive.
- Avoid unnecessary long alt text.
- Include tactile graphics when possible.
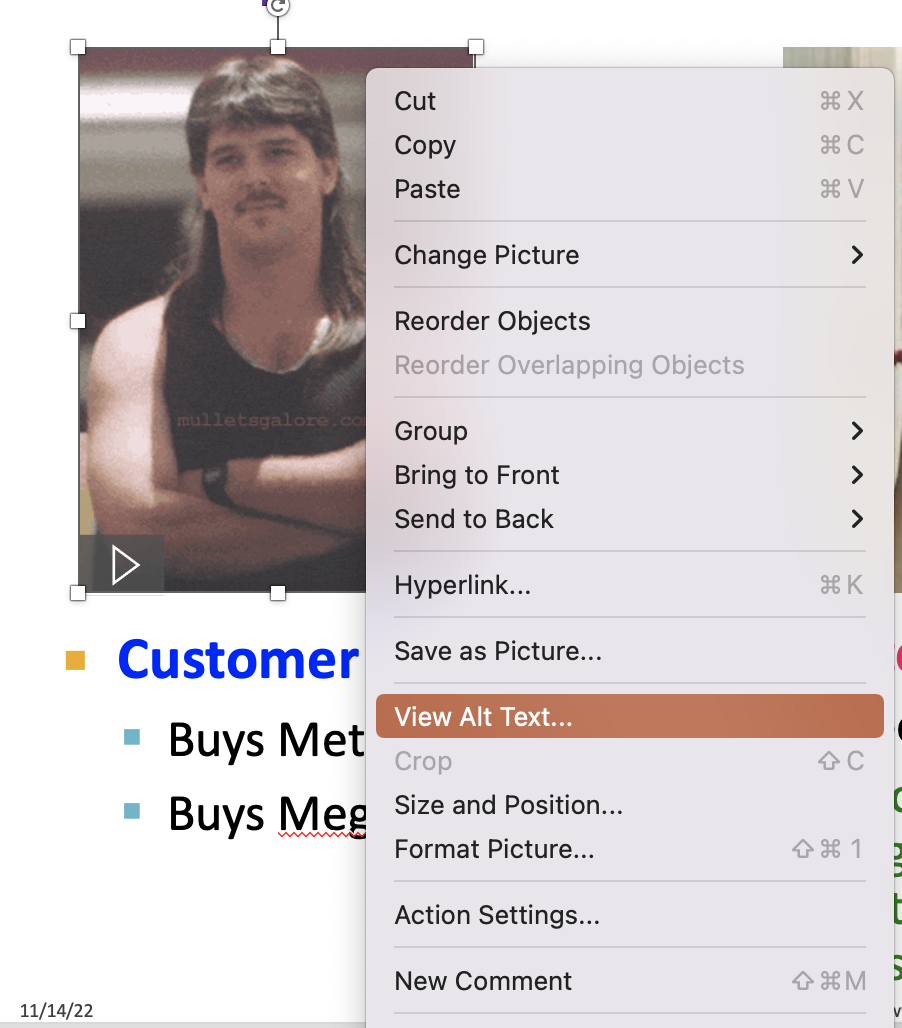
1. Right-click a picture and find View Alt Text.
2. Write and edit the alt text.
The Alt Text pane will show up on the right. You can simply add a description.
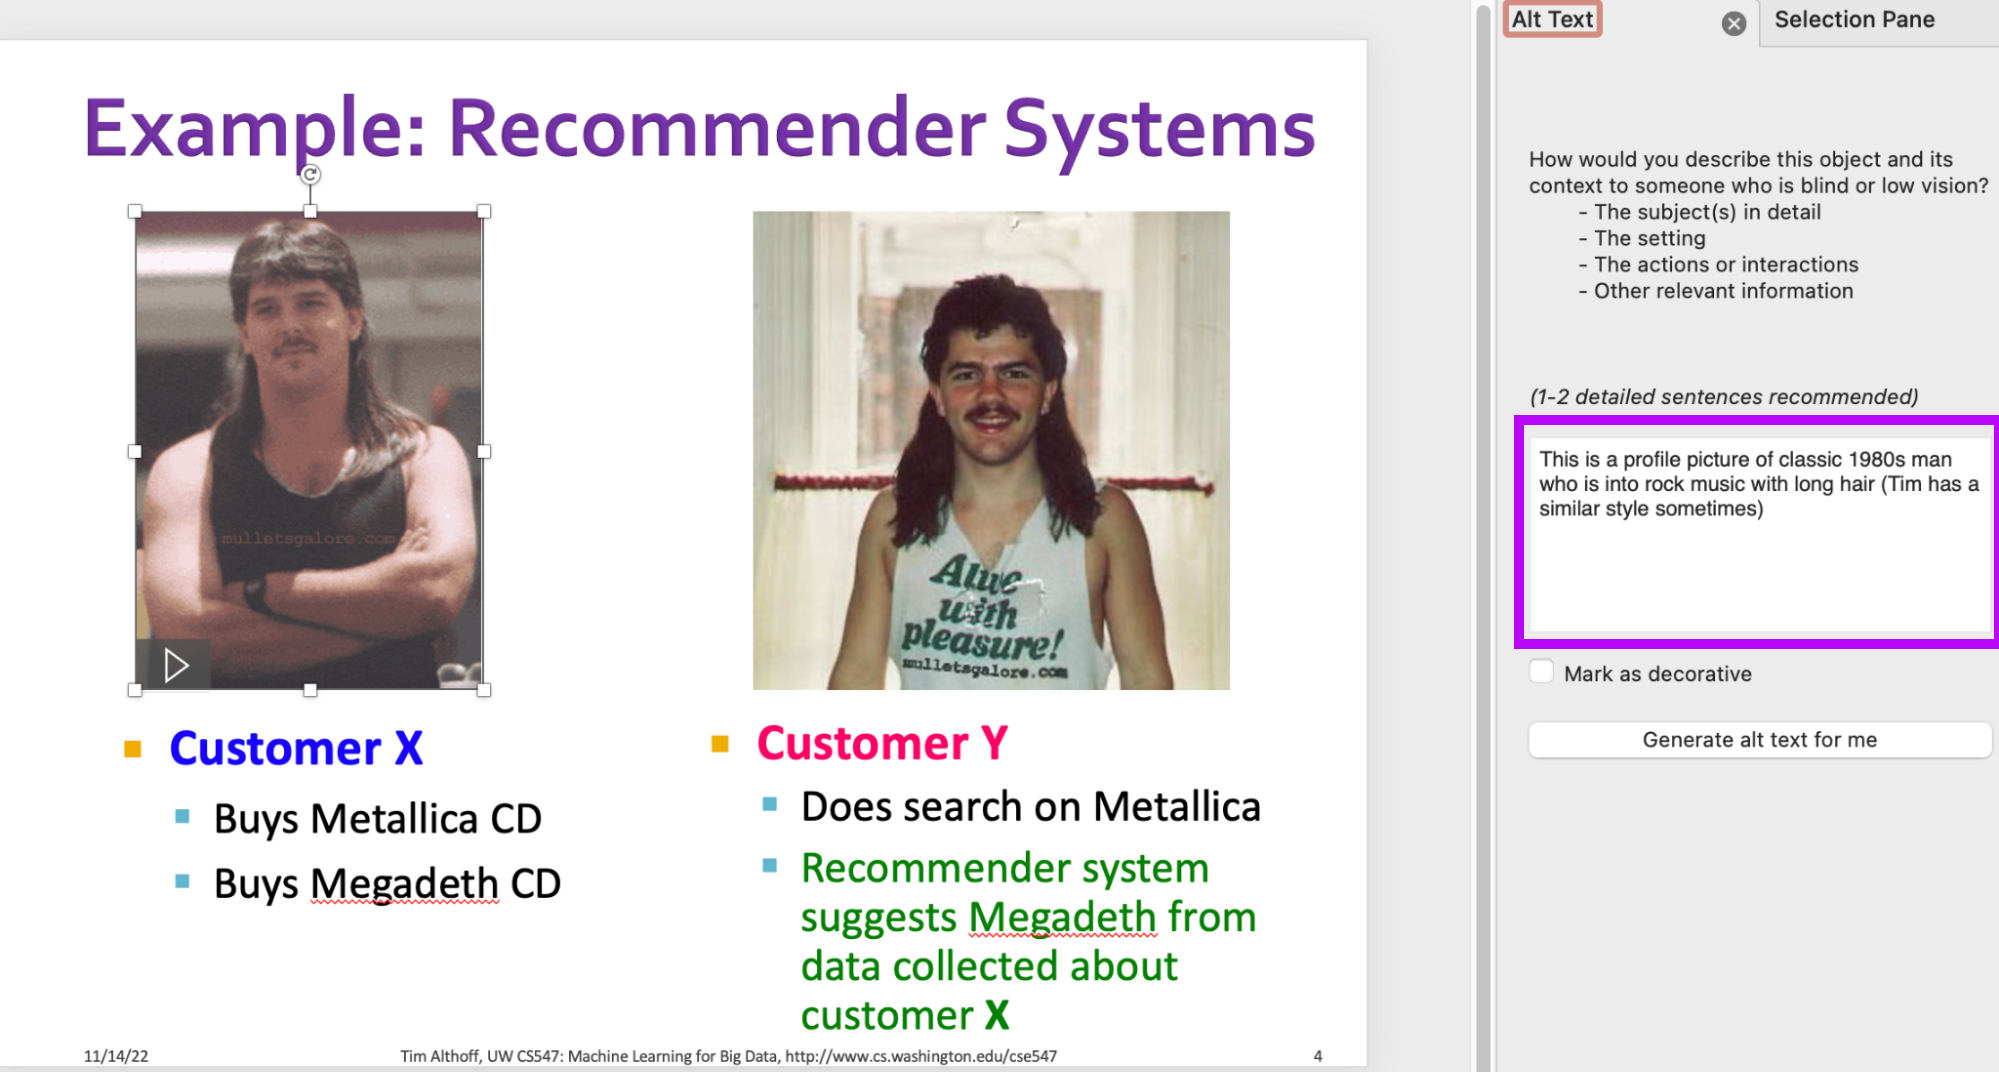
3. Make your alt text descriptive.
It is important to make your alt text descriptive and specific. For example, the alt text above “This is a profile picture of classic 1980s man who is into rock music with long hair” detailed the picture pretty well. In contrast, you shouldn’t simply say “Customer X”.
For more details on how to write image descriptions, please see this guide.
4. Avoid unnecessary long alt text.
Your alt text shouldn’t be unnecessarily long. Consider why you included that image. What point were you trying to get across? Use this purpose to help you select what details to include. Look at the example below. For the scatter plot and red line, we actually don’t care about the number of points or the color of these points or lines. We want to convey that the line is the singular vector that captures the most variance of these points, meaning that the line is aligned with the points in 2D space.
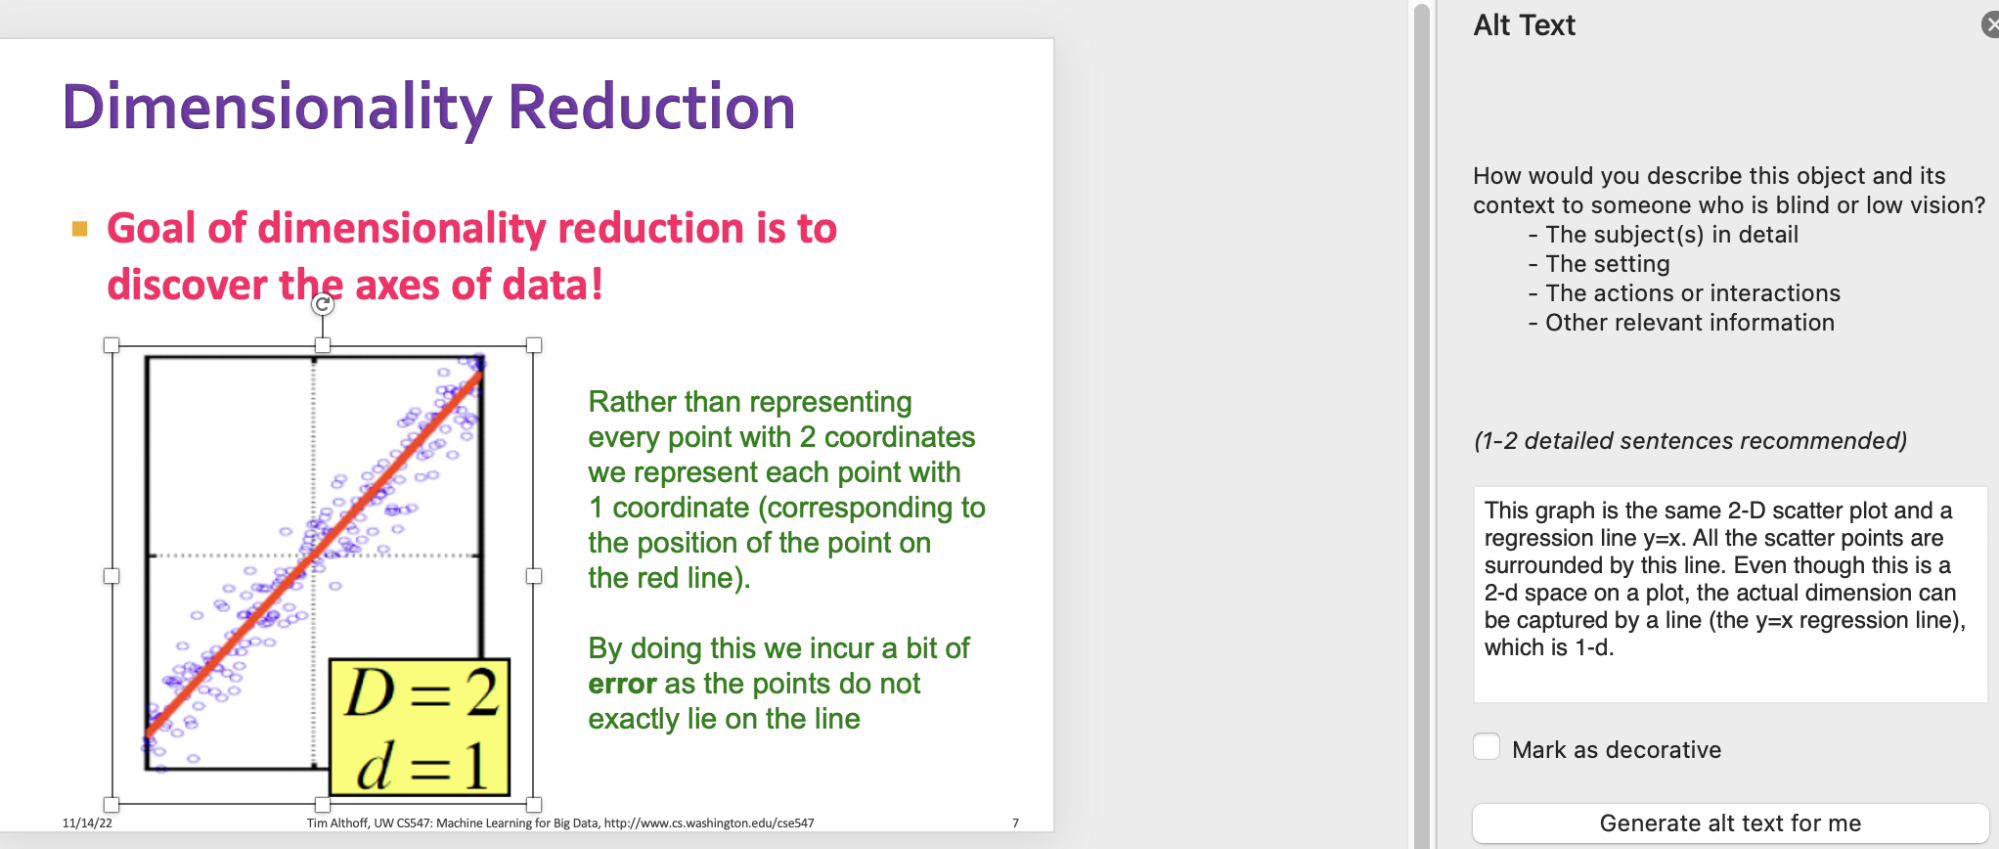
5. Include tactile graphics when possible.
Complement graphs with tactile graphics when possible. For the dimensionality reduction example, it may be beneficial to add tactile graphics so that the students can “feel” what you are talking about. Please refer to THIS SECTION.